What is Forex Trend
Price prediction and “reading” of graphs often helps market participants better understand and know the direction of movement of certain currencies. Following the trend of the FOREX market is one of the most popular strategies. The trend has continued for a very long time in foreign exchange markets. In practice, the trend may last for years. It is possible to make profits while trying to buy at the bottom and selling at the top, but it’s much more likely to earn more money and save a bunch of trouble if you just follow the trend.
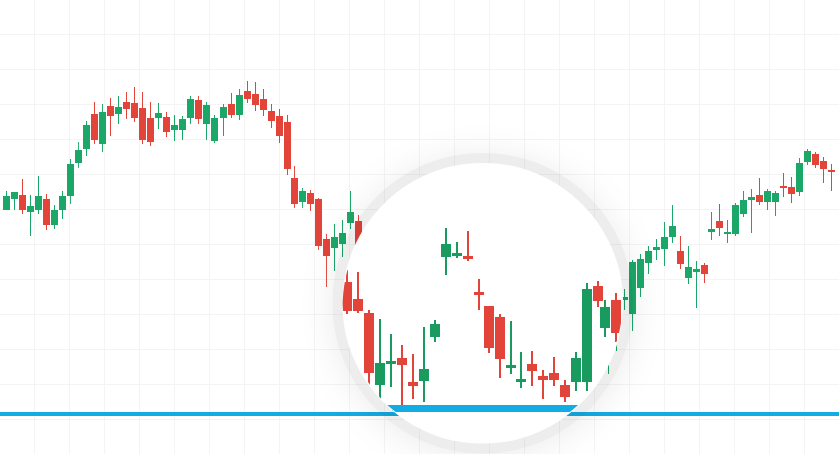
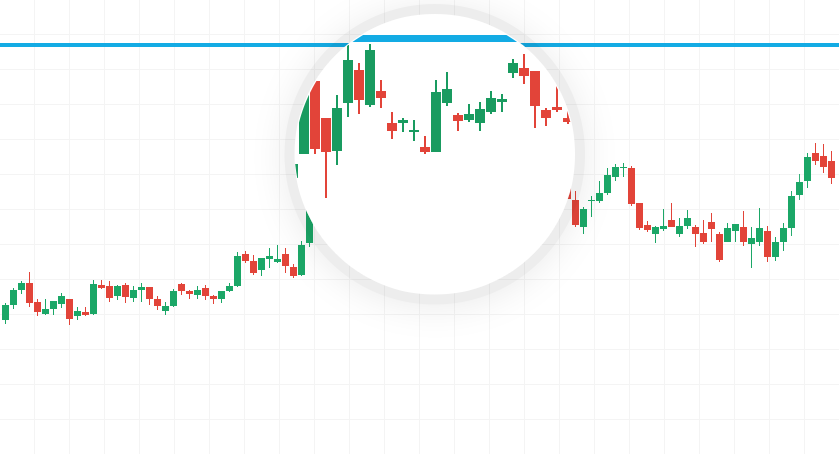
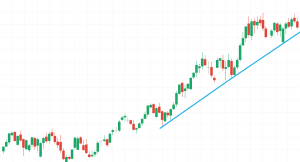
How to draw a trend line? We need two points, for example, the lowest values that the price has reached to draw a line. When it reaches the third point, we will get a trend line. If the price reaches the trendline again, it should rebound from it.
We need 3 points to draw a trend line
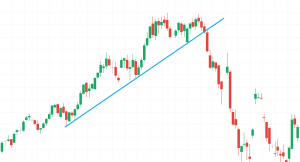
When we talk about FOREX, it’s important to know that it’s about trading in the currencies of different countries. For countries it is characteristic to develop a long time for good or long time badly. National economies do not develop well or badly. That is why the trend tends to last for a very long time. Speculators say that “Trend is your friend” and you have to play in his direction. That’s when the trend is over. Forex markets are extremely volatile and when the trend turns its course, it happens very quickly.
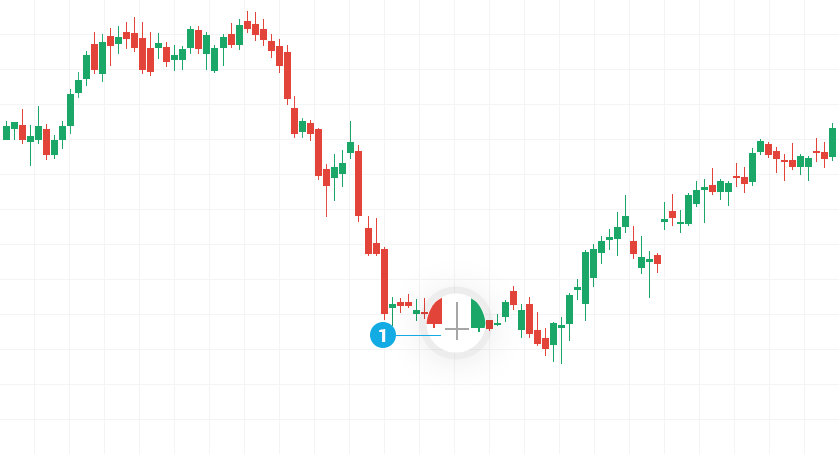
The Trend is distributed by massive sales.
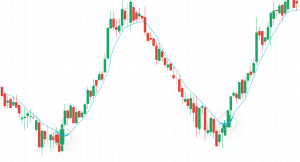
How to use Simple Moving Averages (SMA)?
One of the most popular tools used by market players is the Creeping Average or Simple Moving Average (SMA). The rising average is a statistical tool and is used to smooth out short-term price movements and show us the formation of a long-term trend.
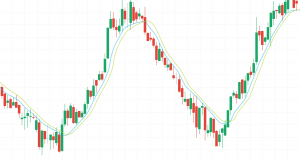
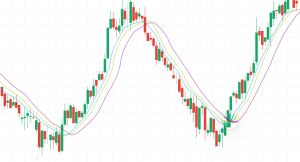
2 SMA with different periods on “candle”
2 SMA with different periods on Candle Type Chart
How to Draw Retractable Medium (SMA)? Each point on the line represents a sum of a number of previous prices divided by the number of used prices. So, point after point is the SMA curve. The SMA so obtained can be used to generate “buy” or “sell” signals. See how!
The price crosses and closes over SMA – purchase signal
A purchase alert is generated when the price crosses and closes above the Creeping Average.
The most successful way to use this tool is to use at least two or three Creeping averages that cover different time periods on the same graph. Speculators usually prefer to use 20, 50, and 200-day SMAs. In this case, the “buy” signal is generated when a shorter moving average crosses over a longer term. Last but not least, you can follow the direction of the Rising Average. If it moves upwards, you can see that the market is set up positively and vice versa if it points down – then the mood is negative.
A golden cross – BUY signal
How do we notice trend adjustments using the Fibonacci correction?
You have probably noticed that currencies are moving zigzagly up, down or without a certain direction. In this regard, after a large rise in the price of a currency pair, we should expect the price to fall temporarily and then likely to continue moving in its original direction. This temporary downward movement is called correction. The same is true in the opposite case – when the price has dropped dramatically, we can expect upward adjustment and downward trend. Some speculators like to trade exactly with such adjustments, predicting their size using the Fibonacci method.
This is a principle based on the infinite sequence of numbers discovered in the 13th century by the Italian mathematician Leonardo Fibonacci. Basically, this method is made up of mathematical calculations. You have to take two numbers, for example one and two, and by collecting them you will get the third number in the series. Here’s an example:
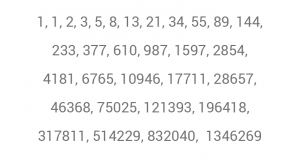
The most significant feature associated with this numerical series is that each successive number is approximately 1,618 times larger than the previous one. Using Fibonacci numbers, we can calculate the following percentages:
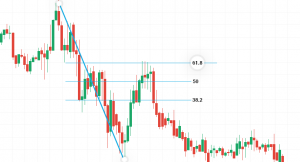
The most important level of Fibonacci is 61.8%. It is also called the “golden level”. This percentage is obtained by dividing one number from the sequence of the number after it – for example 21/34 = 0.6176.
The 38.2% level is obtained when you divide one number from the sequence of the number that is in a number to the right of it – for example 55/144 = 0.3819.
The 23.7% level occurs when you divide a single number from the sequence of the number that is in two numbers to the right of it – for example, 13/55 = 0.2363.
By dividing the big movement in one direction at the above levels, we can expect the price to make a correction between 38.20% and 61.80% of the main move before continuing in the same direction.
These ratios play an important role in the forex market, just as in many places. They also occur in antiquity, such as the ancient pyramids where the height of the pyramid is 61.80% of the length of the base.
What are Eliot’s Waves?
Elliot’s waves are a popular tool for technical analysis widely used by speculators on the FOREX market. In 1930, Ralph Nelson Eliot (1871-1948) developed his theory that financial markets were driven by speculators’ psychology. According to him, the attitude of speculators changes from optimism to pessimism and back into natural rhythm, creating specific wave patterns in the movement of instrument prices.
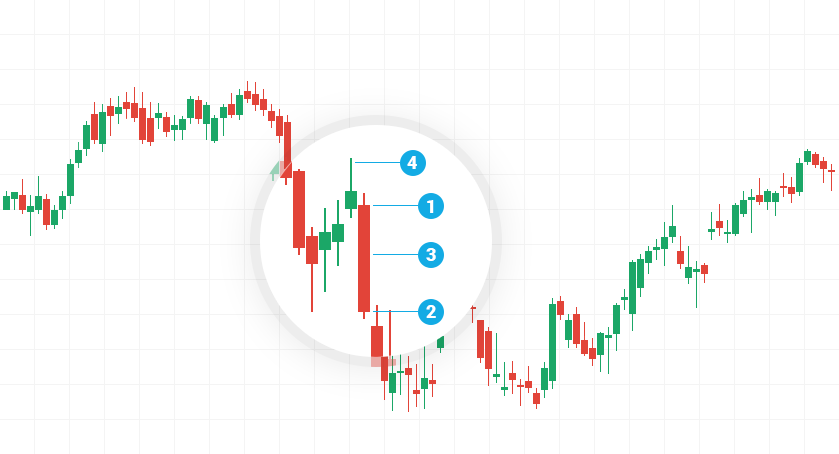
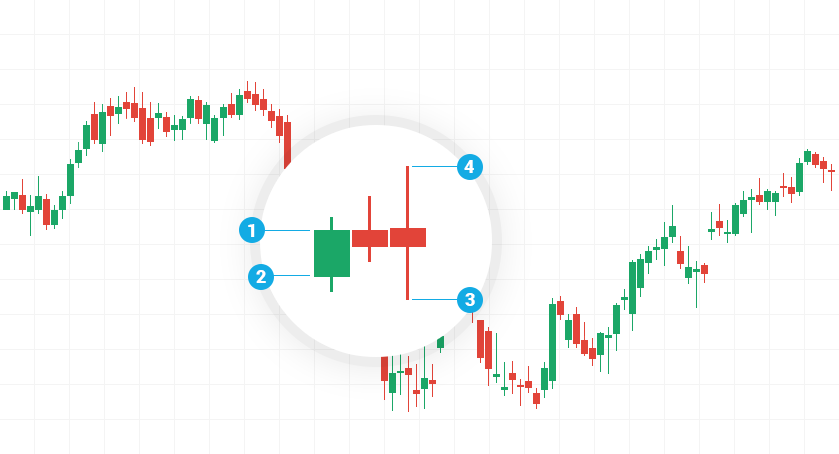
* Market cycle
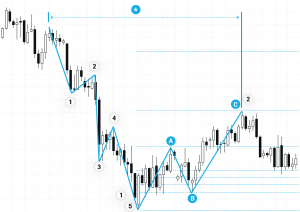
According to Elliott’s theory, instrument prices are moving in repetitive cycles, each of which contains 5 waves in the direction of the trend and 3 waves against the trend. In the dominant trend waves 1, 3 and 5 are called “moving waves” and each is composed of 5 smaller ones. Waves 2 and 4 are called “corrective waves” and are composed of 3 smaller ones. In a falling market, the dominant trend is down and the model is inverted – 5 waves down and 3 upwards. Moving waves are always in the direction of the trend, while the corrective ones are against it.
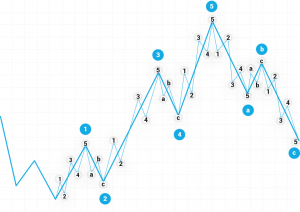
Eliot’s waves are a widespread technical tool that most analysts use continuously. However, to be able to use it in your daily commerce, you have to learn to distinguish the different series of wave movements.